
In today’s fast – paced business world, maintaining accurate and up- to date financial records is crucial for the success of an organization. Odoo, a popular and versatile ERP platform , offers a powerful Accounting module that simplifies and automates accounting processes. One of the standout features of Odoo is its Accounting Reports, which play a pivotal role in empowering businesses to make informed decisions and achieve financial excellence.
Why Odoo Accounting Reports Matter
Accurate and up – to – date financial information forms the backbone of a successful business. Odoo Accounting Reports provide businesses with clear and concise representations of their financial data.These reports are vital for stakeholders , management , and inventors as they enable them to evaluate the company’s financial health , track performance , and plan for the future.
Exploring Odoo 16 Accounting Reports
Odoo 16 introduce a reporting menu with various options, including the Balance Sheet, Profit and Loss Statement , Cash Flow Statement , Executive Summary , Tax Report, General Ledger , Trial Balance , Journal Report, Partner Ledger , Aged Receivable , Aged Payable , Invoice Analysis , and Depreciation Schedule. These diverse reports empower businesses to gain deeper insight and make well -informed financial decisions.
Customizing Accounting Reports
The Odoo Configuration menu allows easy customization of accounting reports. To make changes to a specific report , select it from the list and navigate to the Lines tab. Here , you can add new report lines and specify partner IDs, groupings , and hierarchical levels. You can also create new columns with customized labels and formulas in the Column tab. The Options tab provides advanced customization settings for tailoring reports to meet specific business requirements.
In the configuration menu, there is an option for accounting reports, as displayed in the image below. Within this list, you have the ability to modify the settings of any previously created report.

For example, to make changes to the aged receivable report, simply select it from the provided list. Once selected, you will be directed to the page as shown in the screenshot below.
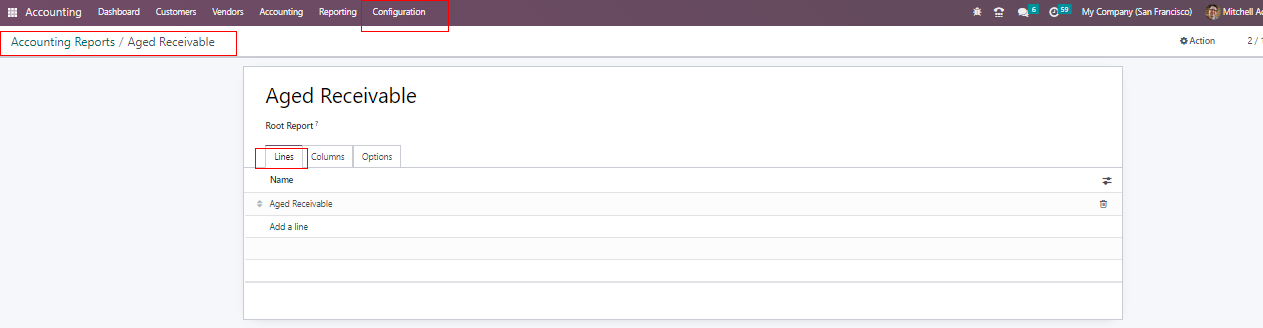
On this page, you will find the name of the report you have selected. To customize the report further, navigate to the “Lines” tab provided on the page. Here, you can utilize the “Add a Line” option to specify new report lines. When you click on the “Add a Line” option, a new window will appear, as depicted in the image below.
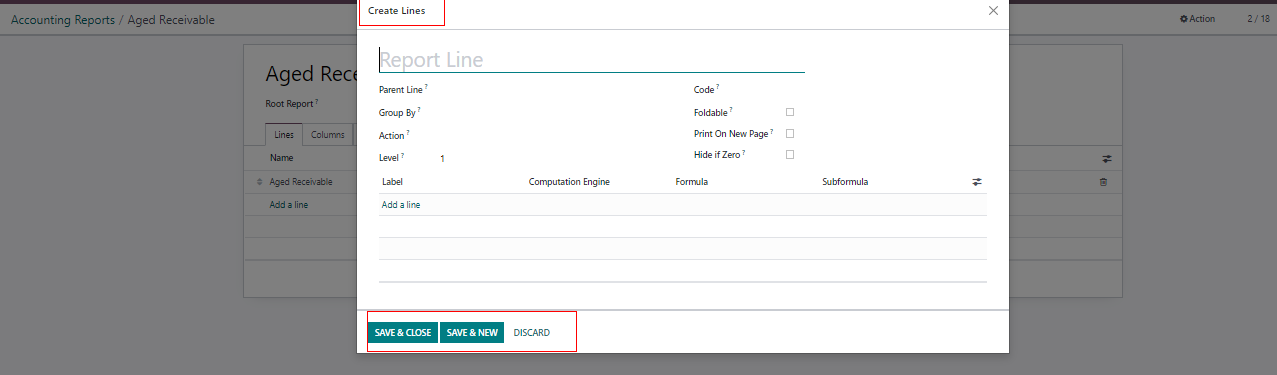
In the financial reports configuration , we are creating a new reports line called Age Receivable. On this page , you will find the Partner line option, allowing you specify the partner ID for this particular reporting line. By providing keys under the Group By field, you can generate a separate list in the report line. To turn the report line into a link , you can utilize the Action field. Additionally , the Level field enables you to set the hierarchical level of the report line.
You can assign a unique identifier to the particular line using the Code field. Enabling the Foldable option will display a folding icon on the report, allowing you to fold the line if needed. The Print on New Page trigger prints the line on a separate page.Activating the Hide If Zero option automatically hides the line when every column of it is set to zero.
To add a new column for this report , navigate to the Column tab , as shown in the screenshot below. In this section , you can use the Add a Line icon to specify the label , computation engine , formula , and sub – formula for the new column.
Once you complete the creation of the new line and column, you will see the new reporting line under the “Aged Receivable” report list. Now, let’s explore how to add a new column for a specific report using the “Column” tab shown in the screenshot.

In the Column tab, you can utilize the Add a Line option to add a new column to the report.For instance ,we will include the column currency in the report. In the available spaces, you can provide a name , an expressive label, and specify the figure type for the new column. Depending on your requirements , you can also enable the Storable and Blank if Zero options.
Once you have configured the column settings, the new column will be added to the aged receivable report.
Now, moving on to the last tab, “Options,” this section provides advanced customization options, allowing you to tailor the reports according to your specific needs. Here, you can fine-tune various settings and parameters to further enhance the report’s layout and functionality. With these advanced options, Odoo enables you to create powerful and highly customized reports that cater to your unique business requirements.
In the Options tab , you have the ability to provide specific details, as depicted in the image above. To control the number of items displayed, you can set a limit value under the Load More Limit option. The Account Group feature can be activated with options like default Never or Optional based on your requirements.
For multi- company settings , you can choose between Use Company Selector or Use Tax Unit. If you wish to disable the option. Additionally , the Default Opening option allows you to set a default time period for the multi – company filter on opening the aged receivable report.
You can include horizontal groups in the provided space and trigger the Analytic Filter and Analytic Group By option if you require other sorting options in the reports.
Moving to the Advanced tab, you will find options like Date Range, Unfold All, Growth Comparison, Period Comparison , and Cash Basis , that can be activated based on your preferences. Below that, you have filtering options such as Account Types , Journals , Partners, Draft Entries, and Unreconciled Entries to be activated under the Filter tabs.
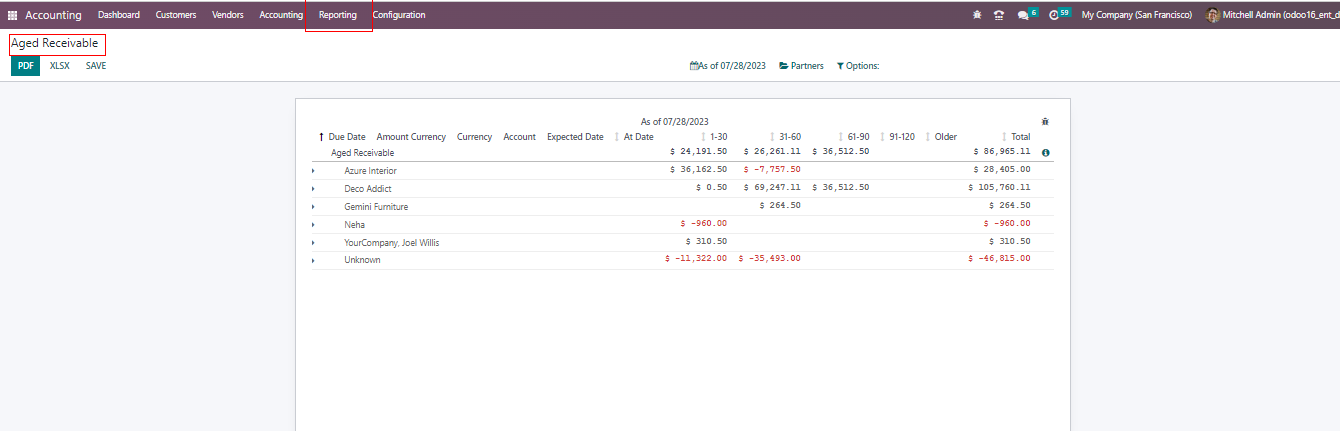
After making the necessary changes in the aged receivable report configuration, save the settings. The modifications will be reflected in the reporting platform, as shown in the screenshot below. This allows you to create customized and comprehensive reports tailored to your specific business needs.
The reporting menu offers various options , including balance sheets, profit and loss, cash flow statements , executive summaries, tax reports , EC sales lists , and more.
Balance Sheet
The balance sheet report provides crucial information about an organization’s assets, liabilities, and equity at a specific point in time. Creating balance sheets is a breeze using the accounting module and selecting the reporting option. By choosing a particular date using the small calendar icon, the balance sheet will be generated for that specific date. The page displaying the balance sheet will appear as shown in the screenshot below. This report enables businesses to assess their financial position accurately and make informed decisions based on their assets and liabilities.
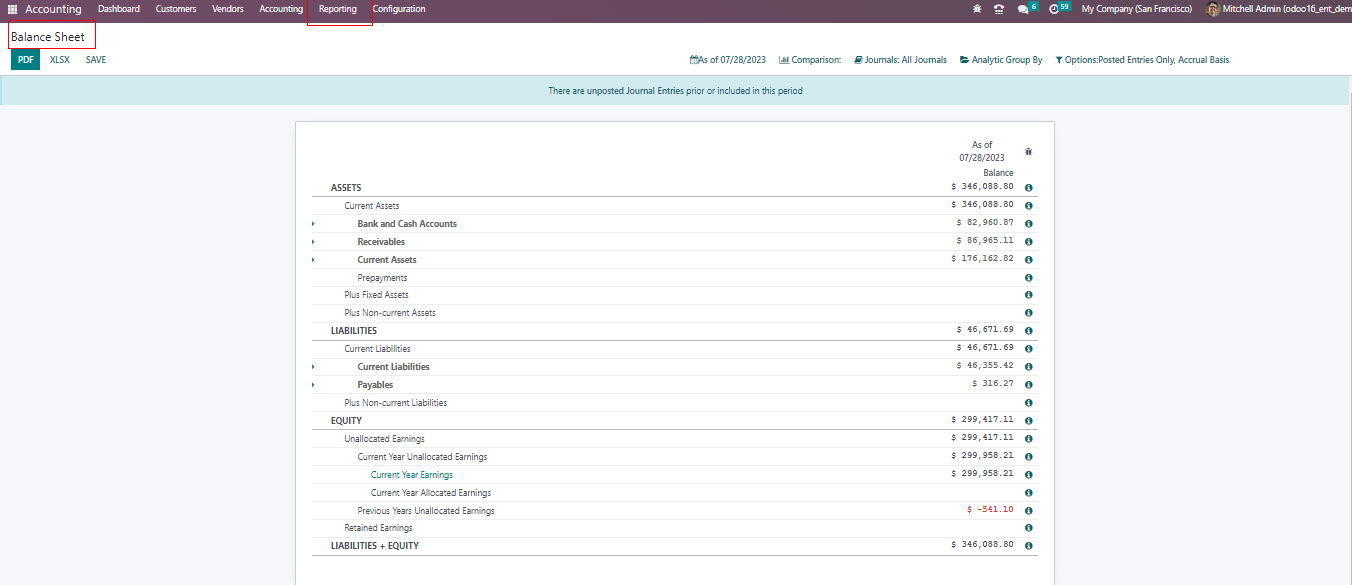
Using the comparison tool, you can compare the report with the previous one. The journal can be selected from the provided journal adoption. On triggering the developer mode, you will get a small icon that shows the calculation formula of the particular reporting line. With the help of the PDF and XLSX options, the data can be converted into the required formula. You can make use of the SAVE icon in order to export the PDF and XLSX of the document. On selecting the save icon, you will get a page, as shown in the image below.

On the export to the option, the document format of the file can be mentioned. The file can be PDF or XLSX. you can also provide the name of the document, folder, and related tags. Finally, go to the EXPORT option.
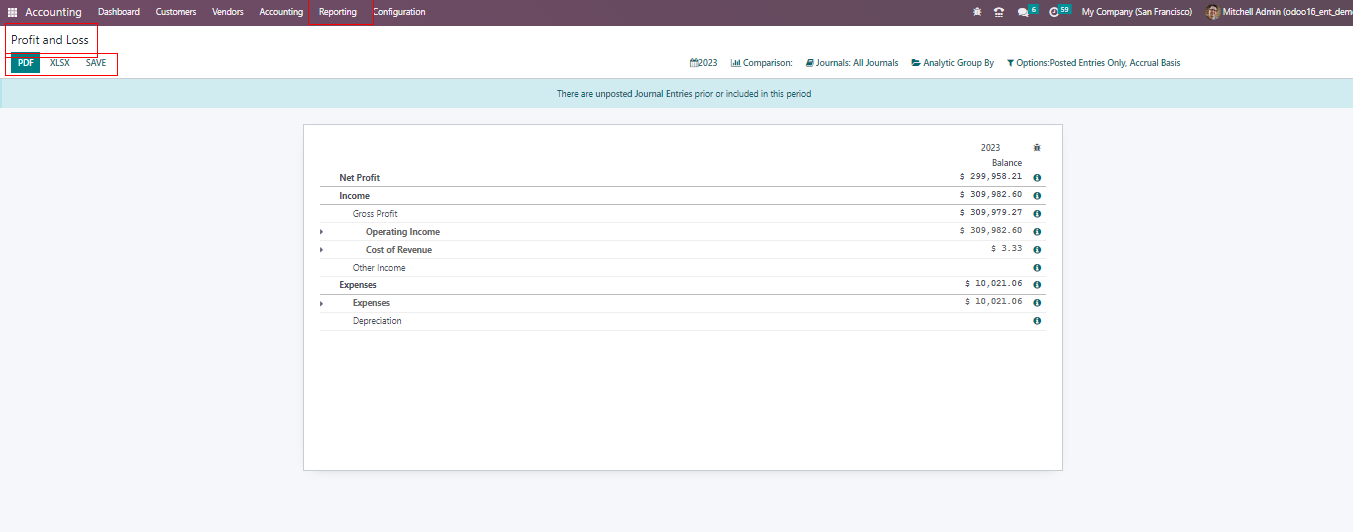
Profit and Loss
The income statements are an important part of financial reporting. Here, you will get revenue, expense, profit, and loss in a particular period of time. The page of profit and loss will be, as shown in the screenshot below.
Cash flow
The cash flows statement presents a comprehensive view of all cash inflows and outflows within an organization.This report is generated based on the accounts created specifically for the cash flow statement. It categories the cash movements into three main activities : operating activities , investment activities , and financial activities.
Operating activities include cash flows from day – to – day business operations, such as sales and expenses. Investment activities encompass cash flows related to the acquisition or sale of long – term assets, like property or equipment. Financial activities involve cash flows associated with raising capital or repaying debts, such as issuing or buying back shares.
When you access the cash flow statement under the reporting option in the accounting module, the page will display the detailed report, as depicted in the image below. This statement provides businesses with a valuable overview of their cash position, aiding in financial analysis and decision-making.

Executive summary
The executive summary provides a concise overview of key financial reports for a specific time period.This includes the cash flow, profitability, and balance sheet reports, offering a comprehensive snapshot of the organization’s financial performance.
Under the performance tab, businesses can access vital metrics such as the gross profit margin, net profit margin , and return on investment. These metrics help assess the company’s profitability and overall financial health.
In the position tab, the executive summary presents essential indicators such as the average debtors’ day, average creditor’s day, short – term cash forecast, and the current assets to liability ratio. These insights assists in evaluating the company’s liquidity, efficiency , and financial stability.
By accessing the executive summary under the reporting option in the accounting module, you will be presented with a well-organized page displaying all these financial metrics and reports, as shown in the image below. This condensed yet informative summary enables businesses to quickly grasp their financial status and make strategic decisions based on key performance indicators.

Tax report
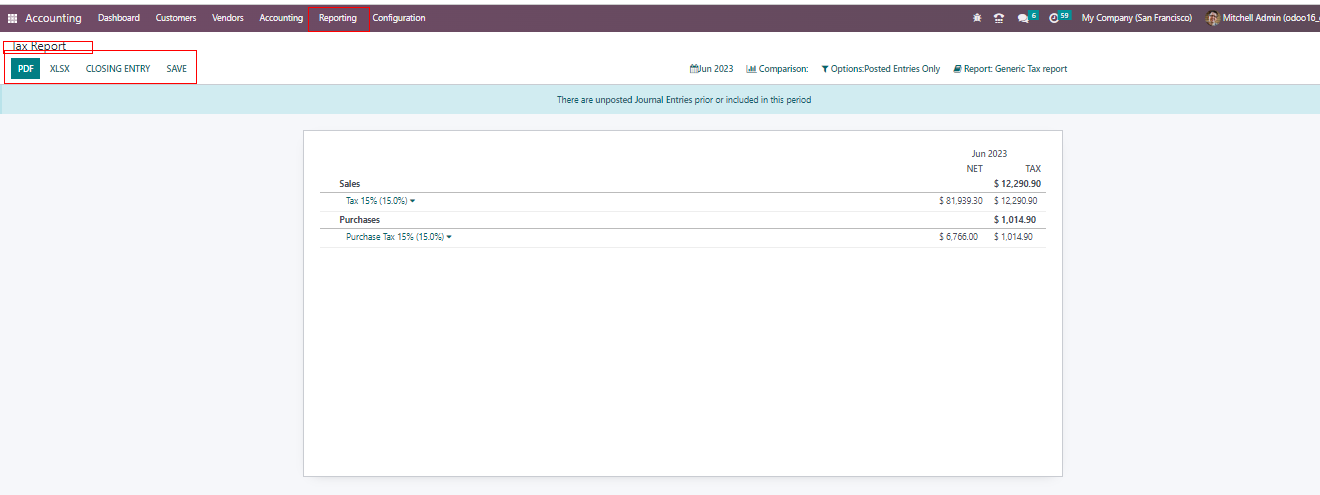
In the screenshot above, you can observe the Tax Report page, accessible from the reporting menu.This page offers detailed reports on sales and purchase taxes. Using the Closing Entry, you can select a specific tax period and generate the relevant tax return for that particular period.
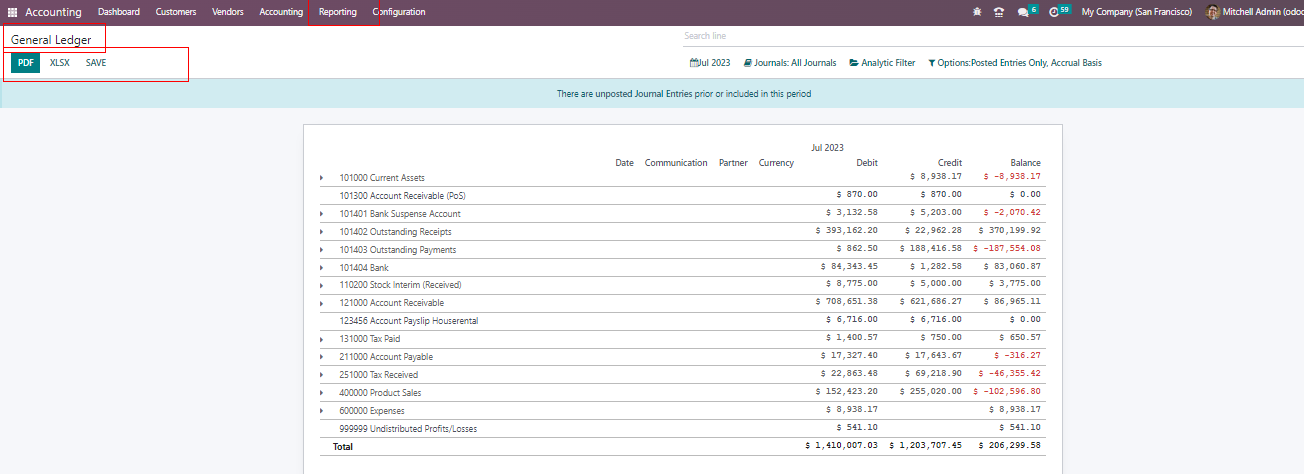
General Ledger
The General Ledger page in the reporting menu displays transaction reports from all configured accounts within a specific time period. It provides detailed information such as account names, dates, communication partners, currencies, debit and credit details, and balances for each account. This comprehensive report maintains records for the organization throughout the financial year. The page offers options to export the report in PDF, XLSX formats, and the ability to save it. The screenshot below illustrates the layout and options available on the General Ledger page.
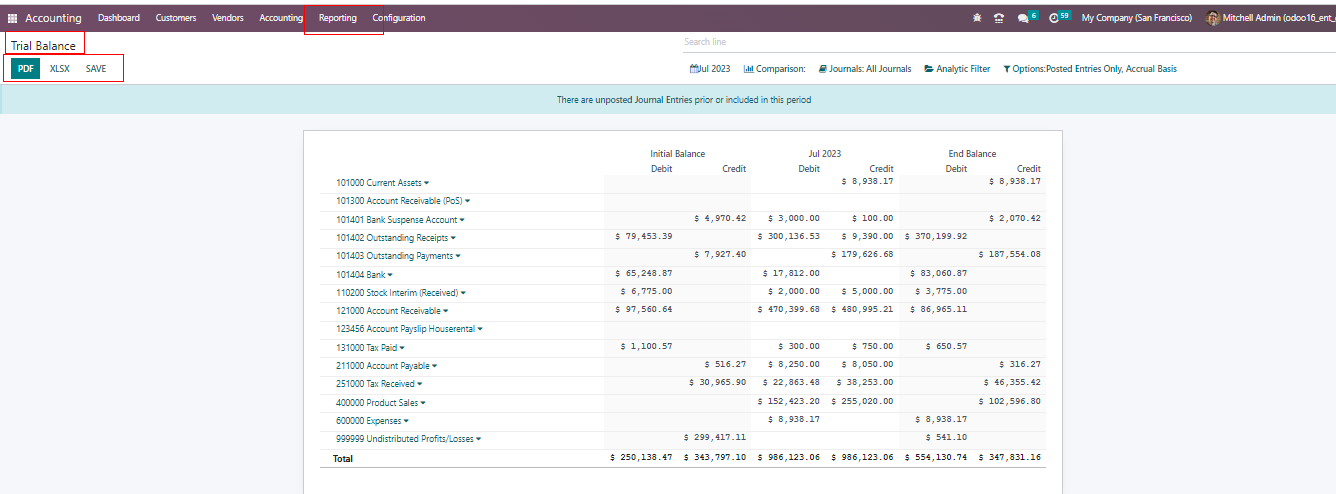
Trial balance
The Trial Balance option is the subsequent feature in the reporting section of the accounting module. It presents the results of account entries posted through various journals and is generated at the end organization’s financial year. These trial balance reports are essential for auditing for auditing purposes.
As shown in the screenshot below , the trial balance displays credit and debit details from the initial balance, selected month or year , and the end balance of journal entries. This report provides a comprehensive overview of the organization’s financial transactions.
Additionally, like other reports, you have the option to export the Trial Balance in PDF, XLSX formats, and the option to save it. The Trial Balance serves as a crucial tool for ensuring accurate accounting and is instrumental in the auditing process.
Journal report
The next option in the accounting module’s reporting menu is the “Journal Report.” This report provides a comprehensive overview of a specific journal, containing information such as the journal’s name, associated accounts, labels, and debit and credit details. The page of the journal report displays all the mentioned details, as shown in the image below. This report is valuable for analyzing and tracking journal entries, aiding in efficient financial record-keeping and analysis.

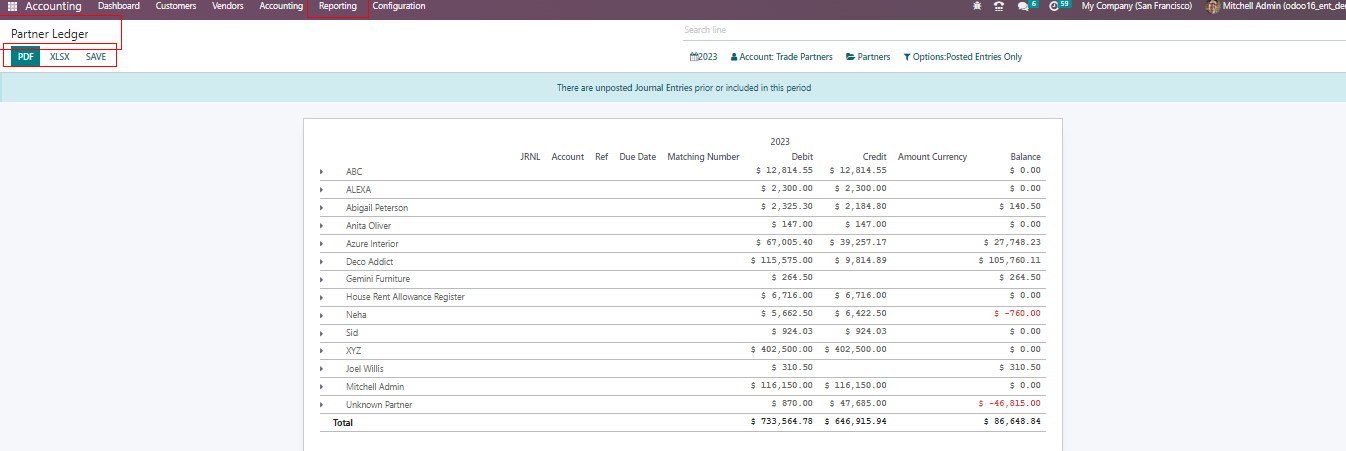
Partner ledger
The Partner Ledger is the report that displays receivable and payable journal entries related to specific partners. On this page, you will find comprehensive details such as the journal , account , reference, due date , matching number , debit , credit , amount , currency , and balance for each partner during the specified period.
To reconcile the accounts of the partners, you can use the Reconcile option provided in this report. This feature allows businesses to ensure accurate accounting and maintain clear records of transactions with their partner.
As shown in the screenshot below, the partner ledger page presents all the mentioned details, providing a clear and organized overview of transactions with each partner. This report simplifies the process of monitoring and managing financial interactions with partners, facilitating efficient record-keeping and reconciliation.
Aged Receivable
The Aged Receivable option in the reporting menu of the accounting module provides reports of aged partner receivable balances based on the selected date. This report shows outstanding payments from customers who have not paid their invoices within the specified payment terms. It displays details such as the selected date , older outstanding amounts, and the total outstanding balance.
The “Aged Receivable” page, as shown in the screenshot above, offers a clear overview of the company’s receivables and helps identify overdue payments. This report aids businesses in managing their accounts receivable effectively and monitoring outstanding invoices to ensure timely payments.

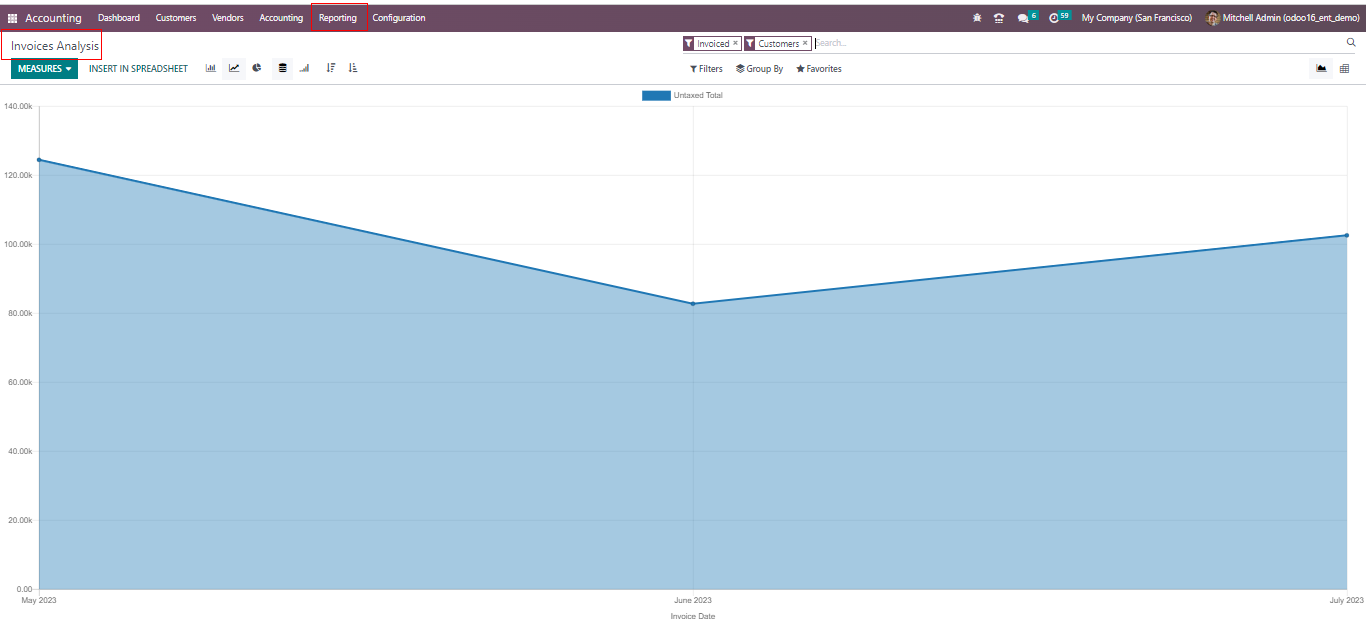
Invoice analysis
The Invoice Analysis option in the reporting menu allows for the analysis of invoice reports within a selected period.This report can be viewed in graphical and pivot views, providing valuable insights into the company’s invoicing activities.
On the page, you will find details such as average price, product quantity , total amount , untaxed total , and count under the measures. The report can be filtered based on options like My Invoice, To Invoice , Invoiced , Customer , Vendor , Invoices Credit Notes , Invoice Date , and Due Date. Custom filters can be created using the customization option for more specific analysis.
Moreover, under the “Group By” option, the report can be grouped by various criteria such as salesperson, sales team, partner, product category, status, company, date, and due date. The “Invoice Analysis” page, as shown in the screenshot below, provides a comprehensive overview of invoicing trends and helps businesses gain better insights into their sales and financial performance.
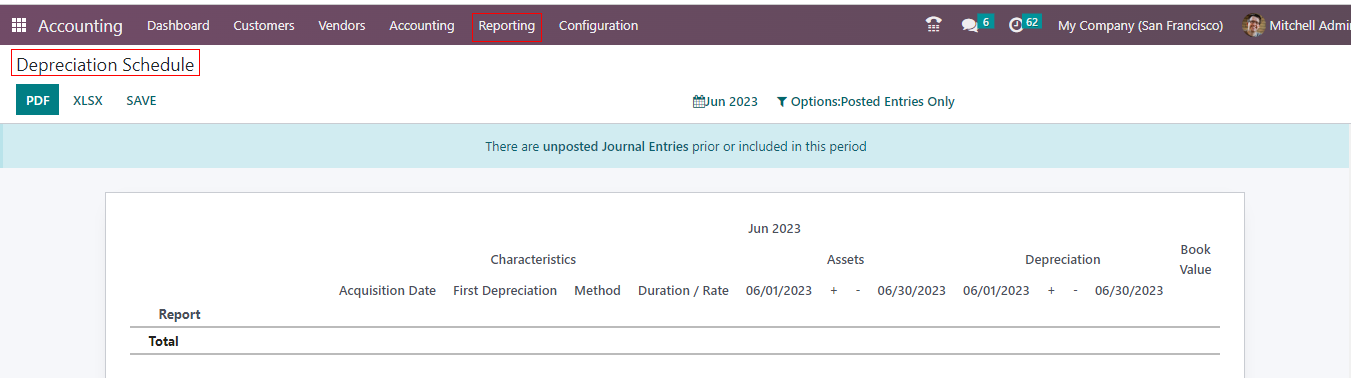
Depreciation schedule
The “Depreciation Schedule” option in the accounting module’s reporting menu displays schedules for the depreciation cost of valuable assets over specific accounting periods. The page provides details like acquisition date, first depreciation, method, duration or rate, depreciation date, and book value. This report assists in managing asset depreciation effectively. Additionally, the accounting reports offer various options tailored to your specific needs.
Odoo 16’s Accounting Reports are powerful tools that empower businesses to maintain accurate financial records, analyze performance, and make well-informed decisions. With a user-friendly interface and advanced customization options, Odoo Accounting Reports offer a comprehensive solution to meet diverse business needs. By harnessing the potential of these reports, businesses can achieve financial excellence and drive success in the competitive market landscape.